Google Analytics 4 VS Universal Analytics: Your 100% Beginner’s Guide!
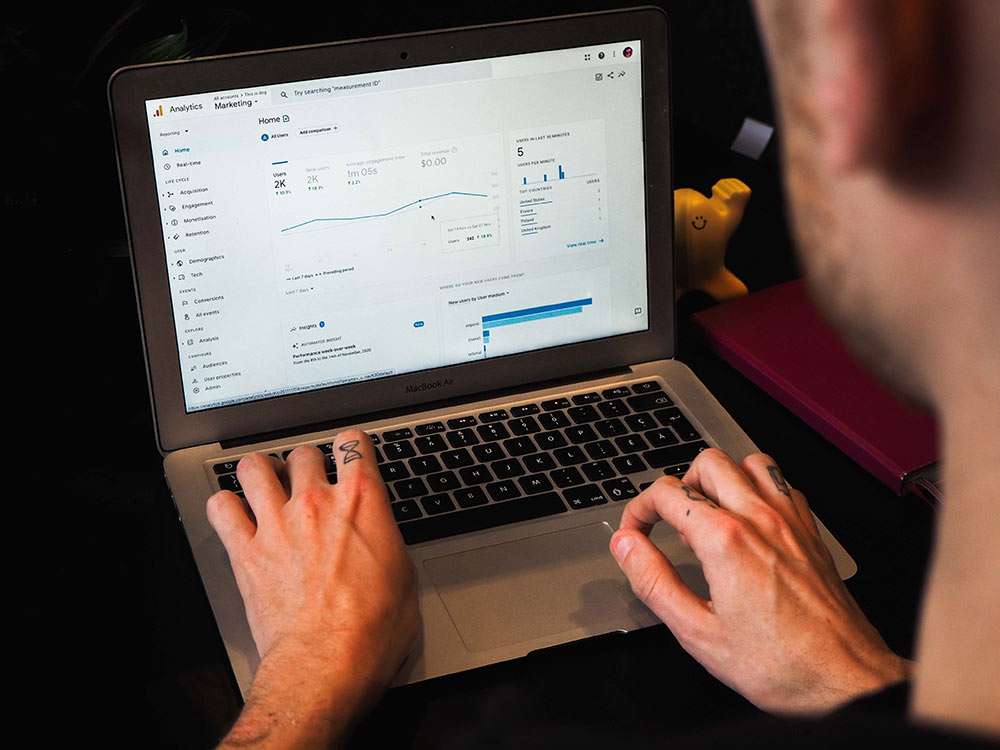
Have you seen or heard all the buzz surrounding Google Analytics' new and improved features? If you're not like us and have never navigated Google Analytics, let alone a whole new platform, this guide will help you get started.
On the bright side, if you've always been perplexed by Google Analytics, here is your chance to master the new platform from the bottom up!
What is Google Analytics 4?
Google Analytics 4 (also known as GA4) is the latest major enhancement to Google Analytics (aka Universal Analytics). It's so large that it'll be its own installation, entirely replacing Google Analytics.
In other words, if you were to launch a website today, you would install GA4 rather than Google Analytics.
Furthermore, if you currently have Google Analytics installed, you must migrate your website property to the new GA4 from Universal Analytics (UA).
What does GA4 mean?
GA4 stands for Google Analytics 4. With the release of Google Analytics 4, a new ecosystem has emerged in the realm of Google Analytics. With Google Analytics Universal Analytics firmly entrenched as the most widely used Analytics platform, most organisations with existing Universal Analytics setups, as well as new enterprises looking to deploy a new analytics platform, face a challenge.
Do I have to use GA4?
Yes. If you run a website and want to collect visitor data to discover what works and what doesn't, you must.
If you have an old analytics property, you cannot just import all of your data onto Google Analytics 4. This is because you must build a fully new property that will begin recording your data in this entirely new manner.
The good news is that you can maintain your previous residence. This way, you'll be able to examine your historical data whenever you want. Unfortunately, this is the only option because there is currently no method to simply merge it all over. This option just does not exist. Perhaps that will happen in the future, but Google made no such commitments.
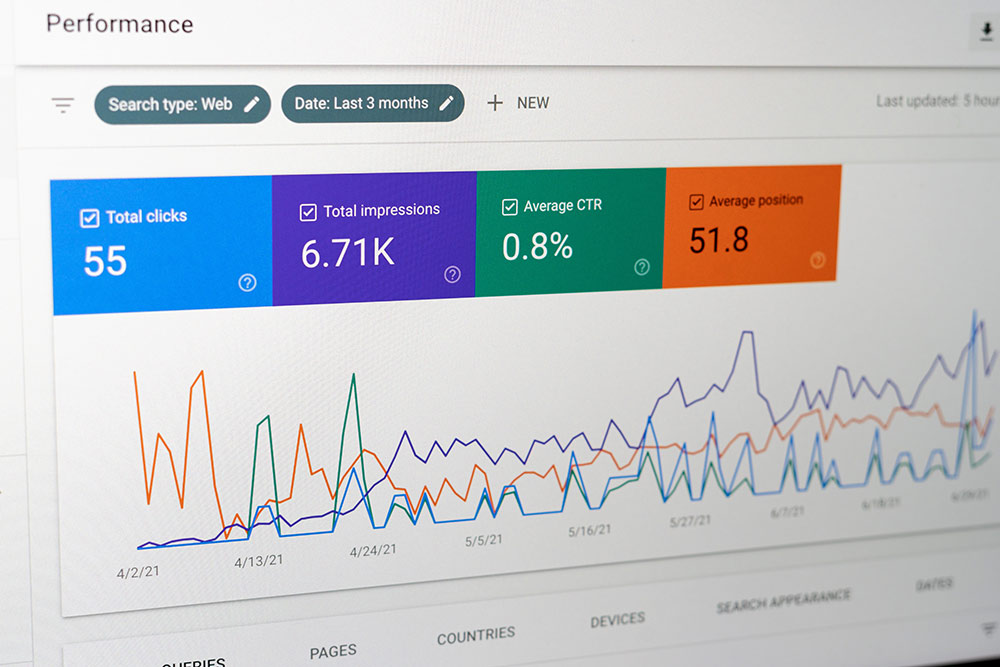
In any case, you must create a new property for Google Analytics 4. After that, you can start transmitting data using your old tracking code, or you can just call your old data your old data, create a new property, and use the new code on your website.
We would recommend the first choice. This way, you can simply copy that code, paste it into your website, and start over. You can access your old property whenever you need to review your past data.
The main difference here is that if you do it the first manner, the old tracking ID will continue to track, allowing you to go to the old property and see both your historical and current statistics.
If you just change the tag and have it only for your new property on your website, you will be looking at your old data at your old property and your new data only on the new property. Both options are perfectly acceptable because moving forward is the only thing that matters.
What are the main benefits of Google Analytics 4?
The key advantage of Google Analytics 4 over Universal Analytics is the ability to perform cross-platform analysis. It means you may now track data from both your website and your apps (through Google Tag Manager or Global Site Tag) (via Firebase).
However, Google Analytics 4 allows you to track users from your websites and applications, so employing this new feature will be a game changer even if you only have a website.
We'll explain it this way - Because Google Analytics 4 reports are substantially more extensive, they may give you an incredible in-depth examination of your audience, including ad hoc funnel and path analysis.
Differences between Google Analytics (Universal Analytics) & GA4
Google Analytics 4 will appear familiar at first glance because the layout design is nearly identical.
At first glance, you might assume there isn't much of a difference, but this is a significant departure from how Google Analytics functioned previously.
So, what makes Google Analytics 4 unique? Previously, Google Analytics operated as follows: someone visits a page, this action fires a code, and states someone was here – the end. That's what Google was looking for.
There was some demographic information, but it was just "someone came to this page."
Of course, you could go a step further and receive information indicating that the same user visited the other website, but that's about it. That's how old Google Analytics calculated time spent on a page and everything.
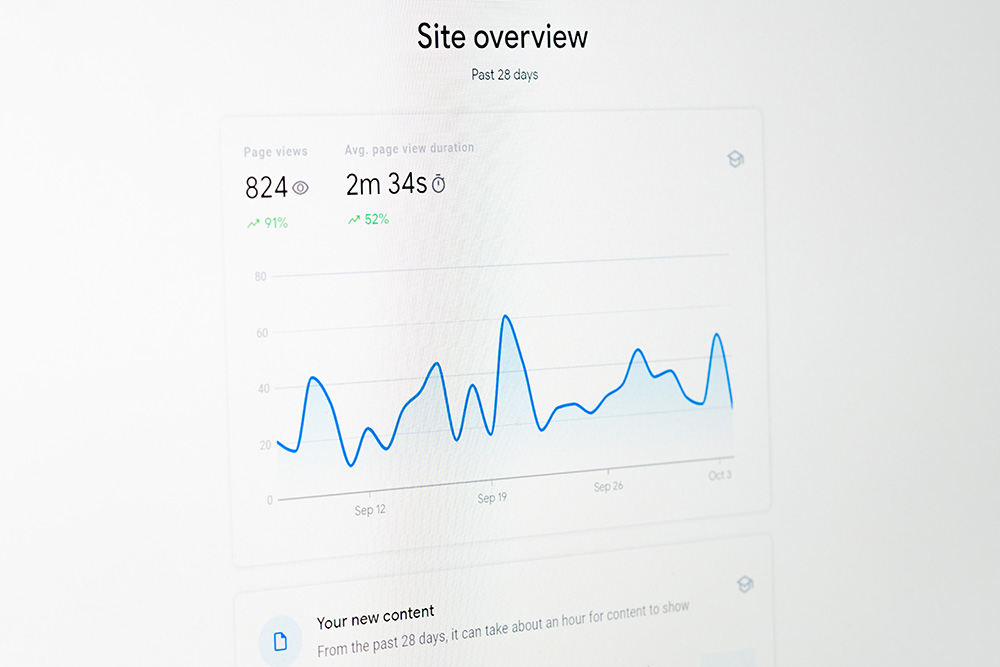
A nice example is when a person visits a page and the same code from the same machine fires the code again two minutes later.
When comparing Universal Analytics to Google Analytics 4, nothing changes for Universal Analytics. But what if we told you it may be another user from the same machine and browser? What if this user was initially on the phone but then went to a computer – you'd have no idea.
The measurement of time on the page was always absolutely off. This is why this number has never come close to indicating what you should be concerned about.
Google Analytics 4 is insanely SMART. The average engagement time is the first item you'll notice on the home page.

This is an interesting number because Google Analytics 4 can measure when people scroll down the page, how much of the page they see, and how long they stay on a page. That is what has significantly altered.
Google Analytics 4 is not the same as Universal Analytics. Instead of tracking a browser cookie base, GA4 has a wealth of user-based data based on Google login users.
For example, if you're on YouTube watching a video and then go to a blog post that's linked to that YouTube video on your computer (which is also logged in to Google), Google may now track that.
It does not have to be a YouTube video, but it may be any type of web content or information product, such as an e-book or a course. Google Analytics 4 will be able to offer you the most valuable data, allowing you to determine where those users first discovered you: on your YouTube channel, on your blog, and which blog article precisely.
How does it work?
You could use the old Google Analytics to set up goal monitoring that would tell you which page the users came from. Unfortunately, you were unable to obtain sufficient information on the browser they were using and the platform on which they were operating.
You can now accomplish far more with Google Analytics 4 than with Universal Analytics. You can get incredibly smart if you have any kind of information product, lead magnets, or anything like that.
The longer you track this data, the more accurate your results will be. As a result, you must act as soon as feasible.
It's fine if you don't have an info product today, but if you do in a year, you'll need this data to understand how your marketing performed.
We'll restate that GA4 appears to be quite similar to UA at first glance, but if you look at the settings in the left-hand menu, you'll realise that they've altered very substantially. One thing you'll notice straight away is that it'll be difficult to discover a specific report from the old analytics. It's just not going to happen.
In reality, if you only want to examine the page views, you will no longer be able to see this information on the home page. To do so, navigate to Engagement and then select the Overview tab.
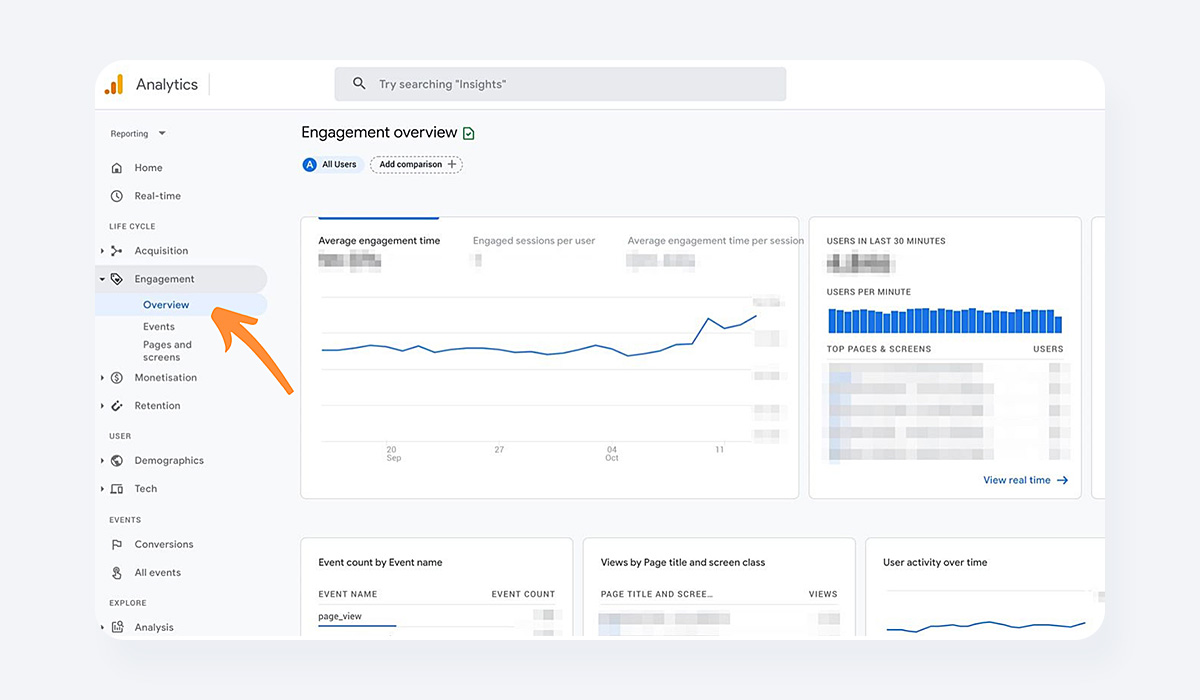
After that, go down to the second chart, where you can see the page views per day, month, or any other time frame that you may set up just like previously.
Google Analytics 4's tracking of your Audiences is far more powerful. When compared to the former goal-tracking in Universal Analytics, GA 4 provides significantly more information due to the way it tracks conversions.
Differences Between UA & GA4
Reports Interface
At first glance, you'll notice that reports that were previously available through Universal Analytics are no longer available through GA4. This is because many GA4 reports will not be generated until you begin tracking events.
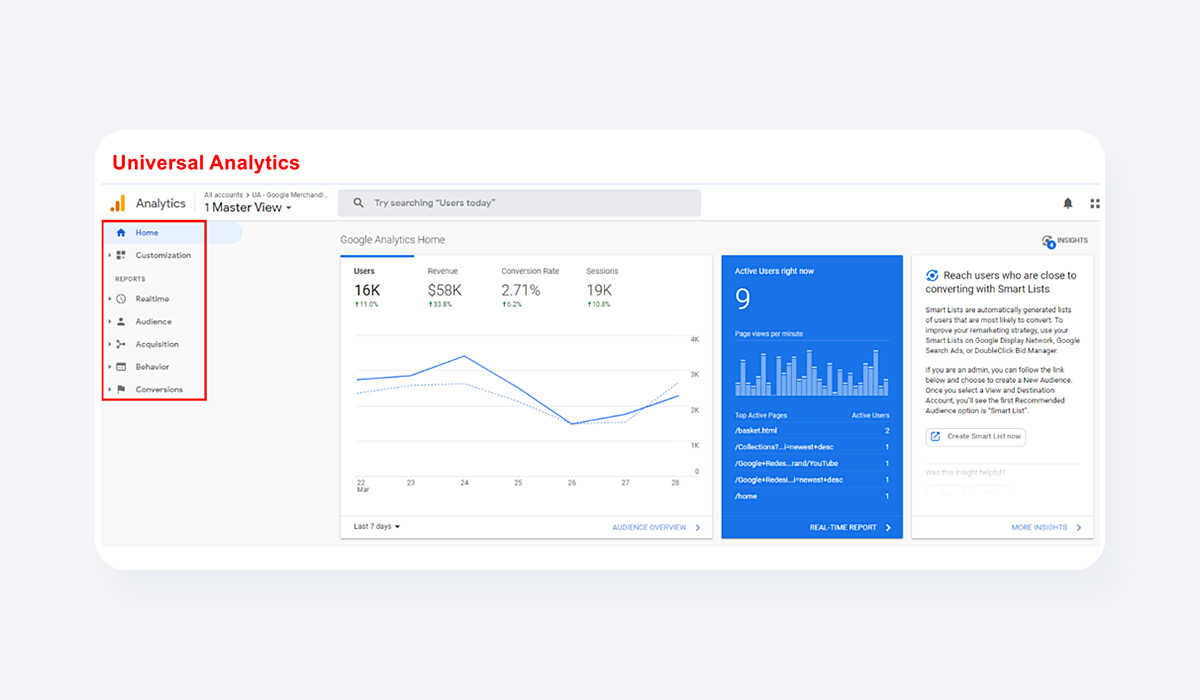
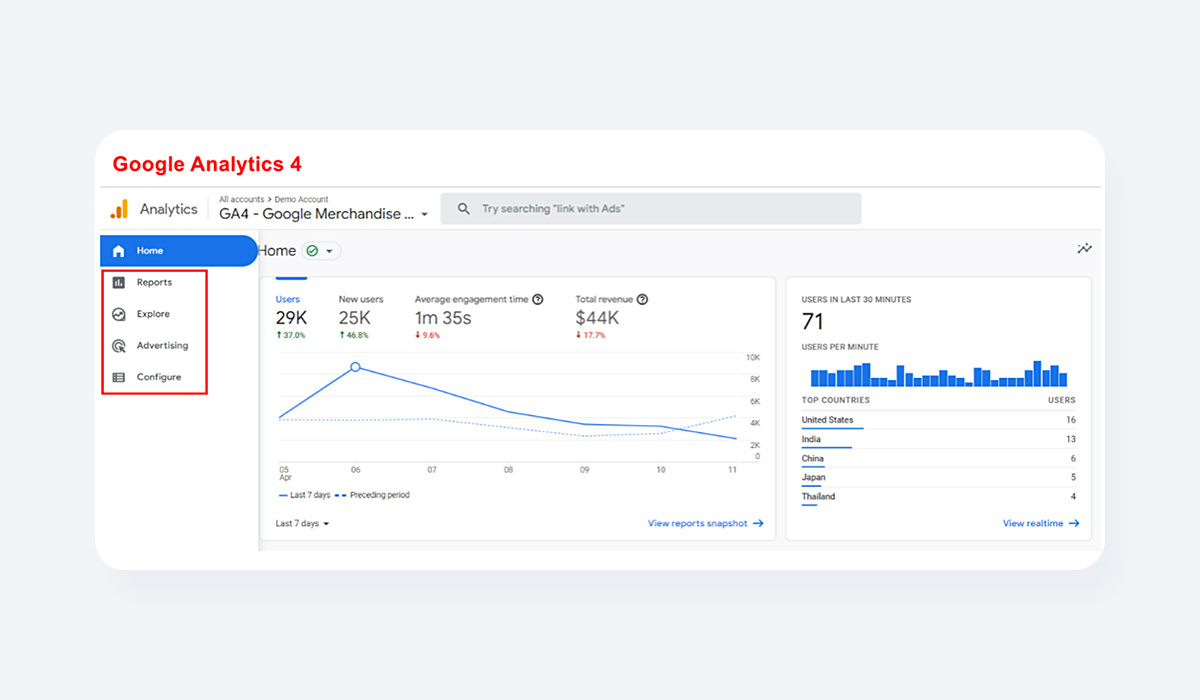
The reason GA4's user interface looks so similar to Google Analytics for Firebase is that GA4 has embraced the Firebase Analytics Data Model.
The GA4 homepage still maintains the side navigation bar, however, it only has four primary navigation tabs as opposed to the five on the UA site:
-
Reports — A collection of default reports tailored to the most frequent reporting use cases.
-
Explore — Offers a set of specialised tools that go beyond regular reports to assist you in uncovering deeper information about your customers' behaviour.
-
Advertising — Reports that assist you in analysing, comprehending, and improving your internet advertising activities.
-
Configure — Here you can customise events, conversions, audiences, and other custom dimensions/metrics, as well as access a DebugView page to test new setups.
Here are some important distinctions between the reporting interfaces of UA and GA:
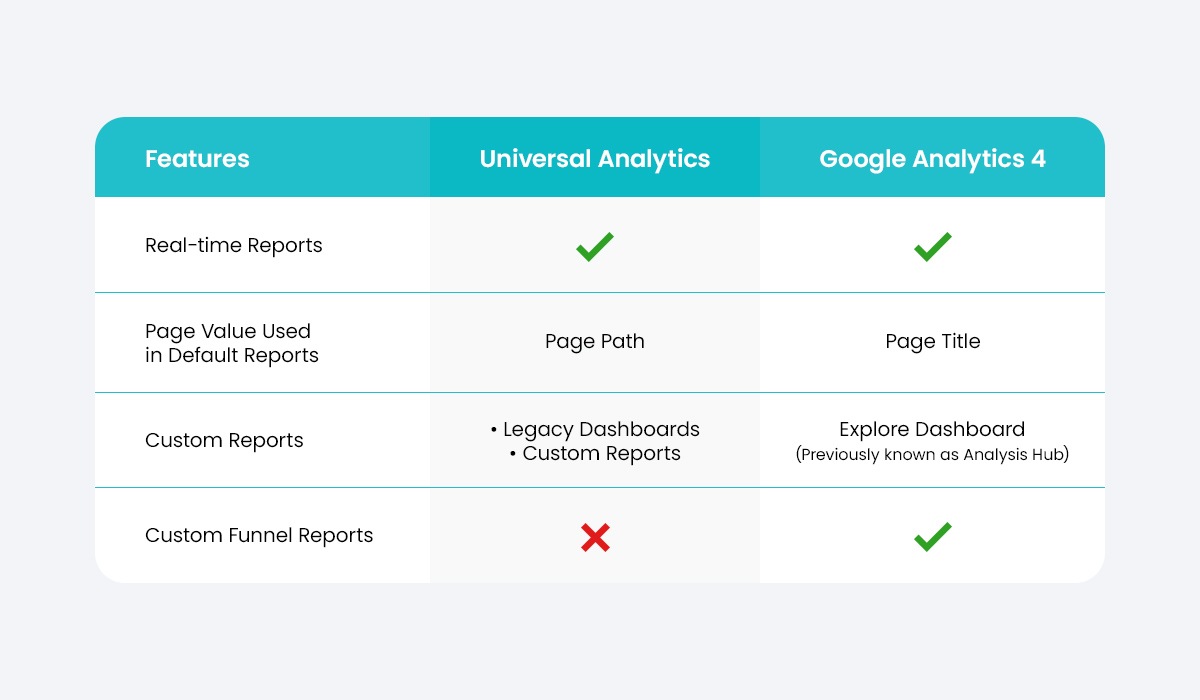
The Reports area in GA4 is now categorised per customer lifetime stage, which are:
-
Acquisition
-
Engagement
-
Monetization
-
Retention
Existing UA users will be familiar with real-time reports and user reports.
Furthermore, the new Library page allows users who have edit access on a GA4 property to customise the reports that everyone sees in the Reports area.
While some UA reports and features are not available on the new GA4 interface, you can go beyond pre-defined reports with exploration tools in the Explore section, which includes upgraded analysis techniques such as enhanced funnel analysis (up to ten funnel steps, up from five) and segment overlap tool.
Measurement
The most notable distinction between UA and GA4 is their separate measuring models:
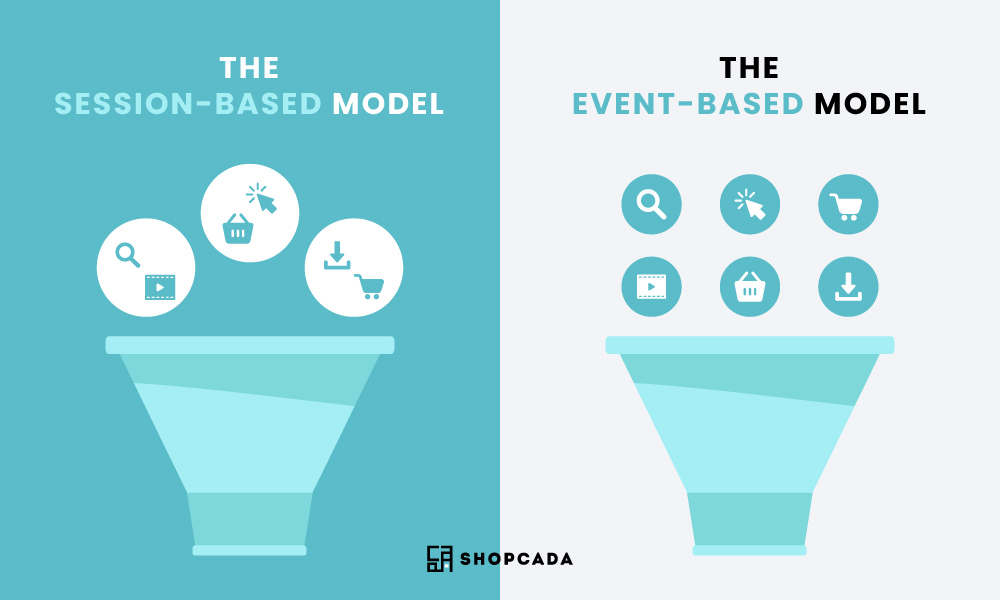
Universal Analytics has a measuring approach based on hits and sessions: a session is defined as a collection of user interactions (or hits) that occur on a website over a specified period. This means that Universal Analytics can capture numerous user activities, such as pageviews, events, and eCommerce transactions, during a single session.
Google Analytics 4, on the other hand, has a measuring methodology based on events and parameters, with each user interaction captured as an event. This allows for a more adaptable measurement methodology that measures various user interactions across platforms and devices.
The table below shows how Universal Analytics hit types are captured on Google Analytics 4:
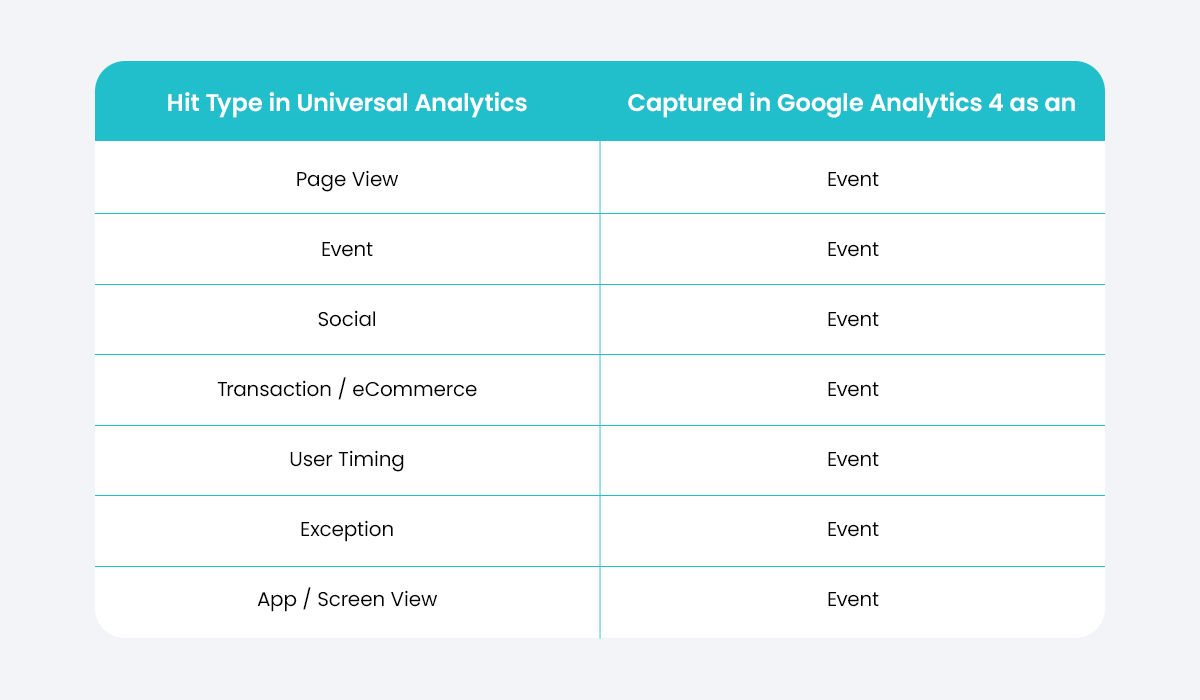
In comparison to UA's session-based data architecture, GA4's event-based model enables event-agnostic tracking, allowing you to apply a custom parameter to each event, providing you freedom in how you track and get insights from your data. This leads us to the following point:
Events Tracking
Google Analytics 4 overhauls Google's tracking process entirely.
If you've used Universal Analytics before, you'll know that all recorded events include one or more of the four particular attributes defined by Google Tag Manager:
Category (required): Used to identify a group of events, such as the "CTA button" or "Videos."
Action (required): A sort of interaction, such as "Clicks" or "Submitted Inquiry Form," is assigned.
Label (optional): Assigned to provide additional information to help identify a specific event, such as a video title, URL, or product name.
Value (optional): This field is used to assign a numerical worth to an event, such as monetary value.
Please keep in mind that the names you gave these four parameters in Google Tag Manager will be mirrored in your UA property.
GA4, on the other hand, believes that every interaction across all web and app visits may be collected as an event, allowing for a more flexible event monitoring configuration with only two parameters:
➀ Event Name: A name given to an event (Note: These are case sensitive, so any two events whose names differ only in letter casing will be distinguished as two separate events)
➁ Custom Parameter: Adds context to depict a user's behaviour (up to 25 custom parameters with each event)
Events under GA4
Events on GA 4 can be broadly categorised into four categories:
✤ Automatically Collected Events
When you install the GA4 tracking code on your website, these events are immediately tracked. The following are some examples of automatically collected events:
-
first visit: The first time a user views your website or app.
-
session start: Identifies when a user first views a specific webpage.
-
user engagement: This metric indicates how long people spend actively using your website or app for at least one second.
✤ Enhanced Measurement Events
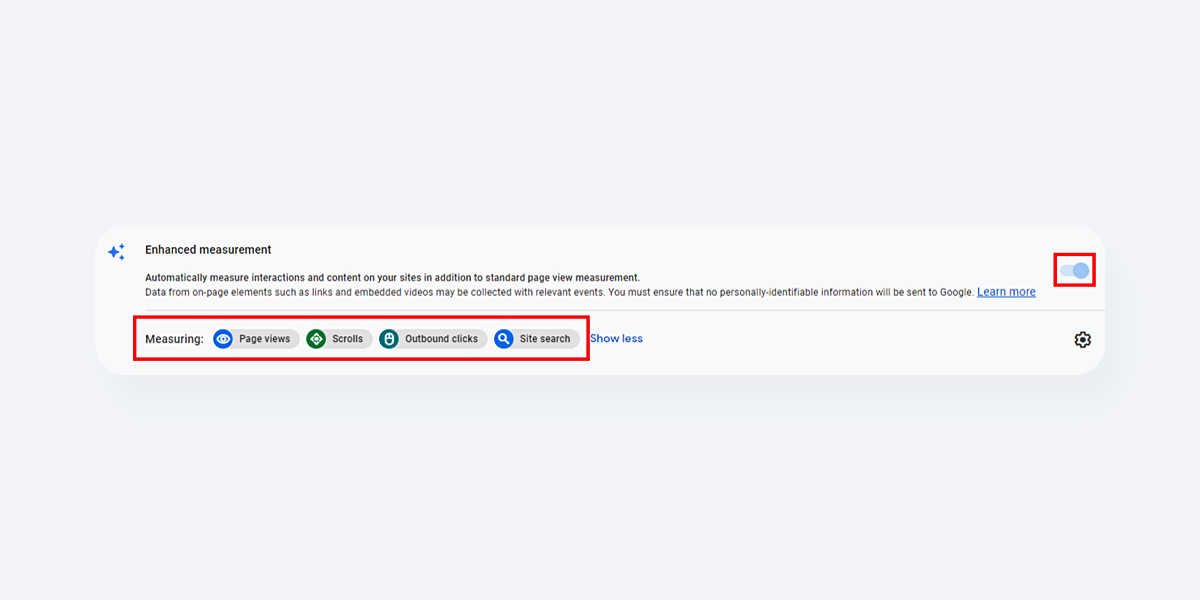
These are additional collections of automatically collected events that must be activated in your settings. Enhanced Measurement Events include the following:
-
Page Views: Indicates the number of times a page has been loaded in a browser.
-
Scrolls: The first time a user reaches the bottom of a webpage (after scrolling down 90% vertical depth).
-
Clicks: Denotes when a person clicks on an external link that takes them to another website.
✤ Recommended Events
These are optional events that Google recommends you implement to better measure user behaviour and inform your reports. Because Recommended Events require more context to be meaningful, they are not broadcast automatically and must be configured explicitly on your website or app. Recommended events include predetermined event titles and characteristics and are classified by industry types, such as retail, online sales, gaming, travel, and lodging.
Here are several examples:
-
Purchase: When a user completes a purchase.
-
Share: When a user shares your content, this is indicated.
-
Remove from cart: This variable indicates when a user removes an item from their shopping cart.
✤ Custom Events
Custom events are events and parameters that you can configure to track any user activities or KPIs that do not fall into the previous three event types. You can currently assign up to 500 uniquely named events, and Google suggests checking its developer guide when writing code to generate custom events.
For example, implementing a custom event named "rate_item" with custom event parameters such as "item_id" and "rating" would tell you which item a specific user assigned a rating to as well as the actual rating they gave.
Try this four-step thought process to help you visualise how to design your events:
-
Step 1: Does the event you want to monitor fall within the category of Automatically Collected Events?
-
Step 2: If you answered "no" in step 1, see if the event comes under Enhanced Measurement Events. If not, continue to step 3.
-
Step 3: Determine whether the event is one of the Recommended Events.
-
Step 4: If you are still unable to locate the desired event in any of the preceding event categories, you should build a Custom Event.
Views VS Data Streams
In general, it's recommended to have at least three views in a Universal Analytics property: one "unfiltered" view to contain raw data, another "test" view to applying configuration changes, and a "master" view to house the goals and configurations you want to work with.
However, rather than views, GA4 uses data streams, which are data streams from your website or app to your Google Analytics account. Depending on your business, there are three data stream sources: web (for websites), iOS (for iOS apps), and Android (for Android apps).
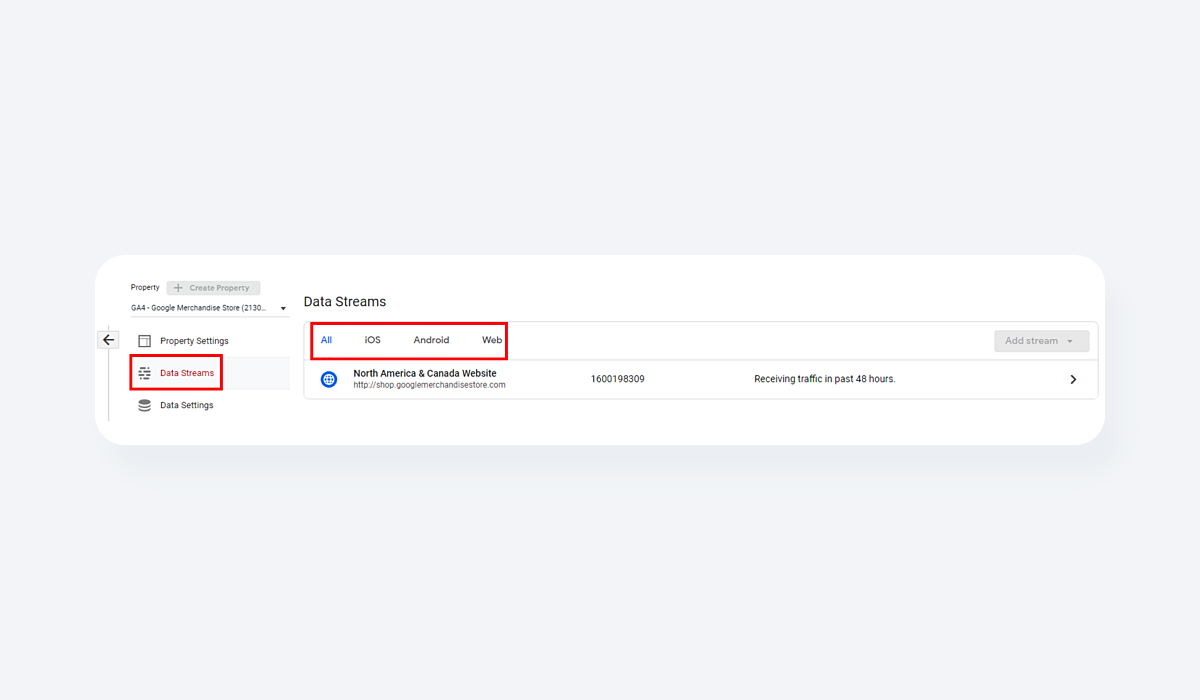
This shifts the account architecture from Account ➞ Property ➞ View to Account ➞ Property ➞ Data Stream, where data is gathered at the property level and reports are seen at the view level.
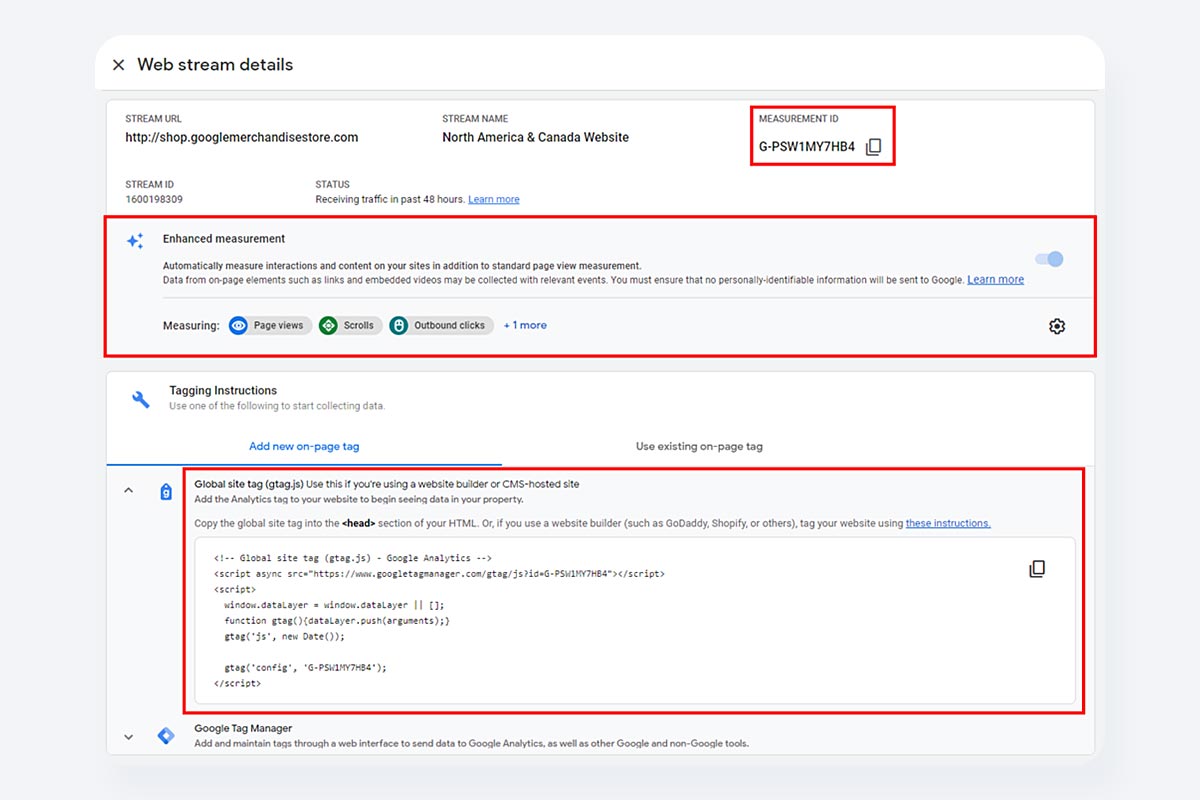
GA4's Data Stream options also allow you to:
-
Locate your measurement ID
-
Allow for improved measuring
-
Look for your global site tag code snippet
Engagement Metrics
Reports on Google Analytics 4 use a new set of engagement indicators when compared to Universal Analytics, including:
-
Engaged Sessions: The number of sessions that lasted more than ten seconds, resulted in a conversion event, or had two or more screen or page views.
-
Engagement Rate: The percentage (%) of users who are engaged
-
Engaged Sessions/User: The average number of engagement sessions per user.
-
Engagement Time: The amount of time your website was in the foreground of a user's browser or your app was in the foreground of their phone screen.
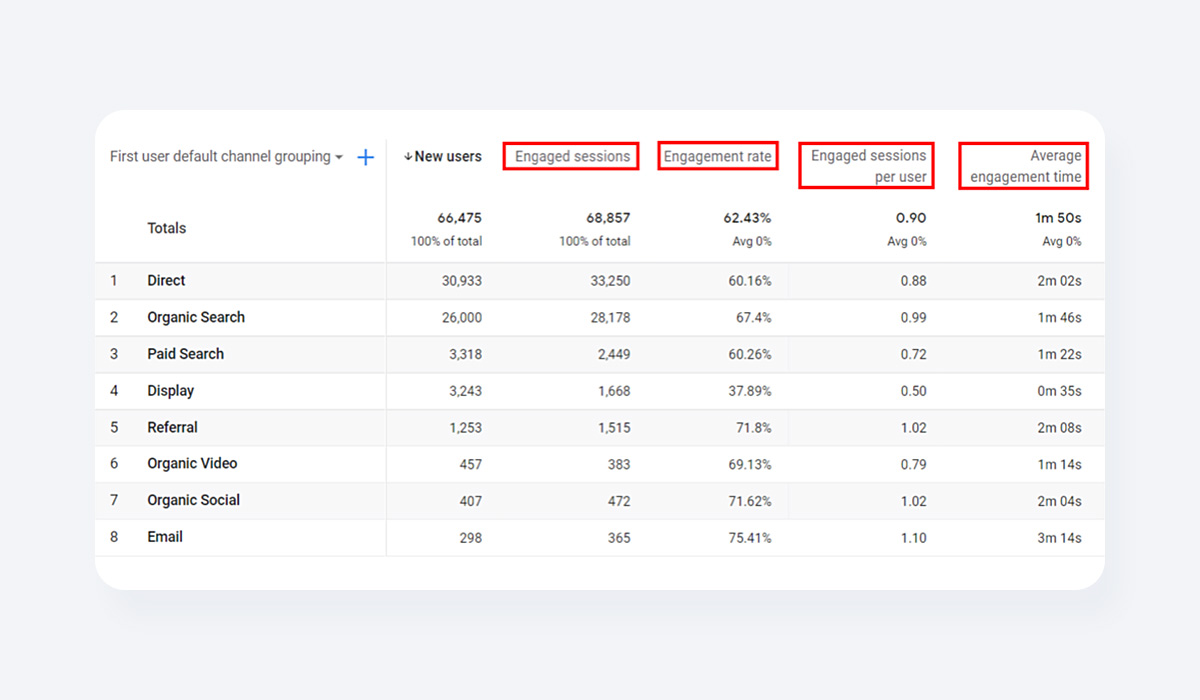
With Google moving the focus of GA4's engagement metrics toward understanding user behaviour across all property types (i.e., websites and apps), we're also saying goodbye to bounce rate, which doesn't apply to applications.
Finally, with GA4, businesses can gain more insights into user behaviour by determining which content on their website or app is the most engaging to their users.
Proper setup of new GA4 property
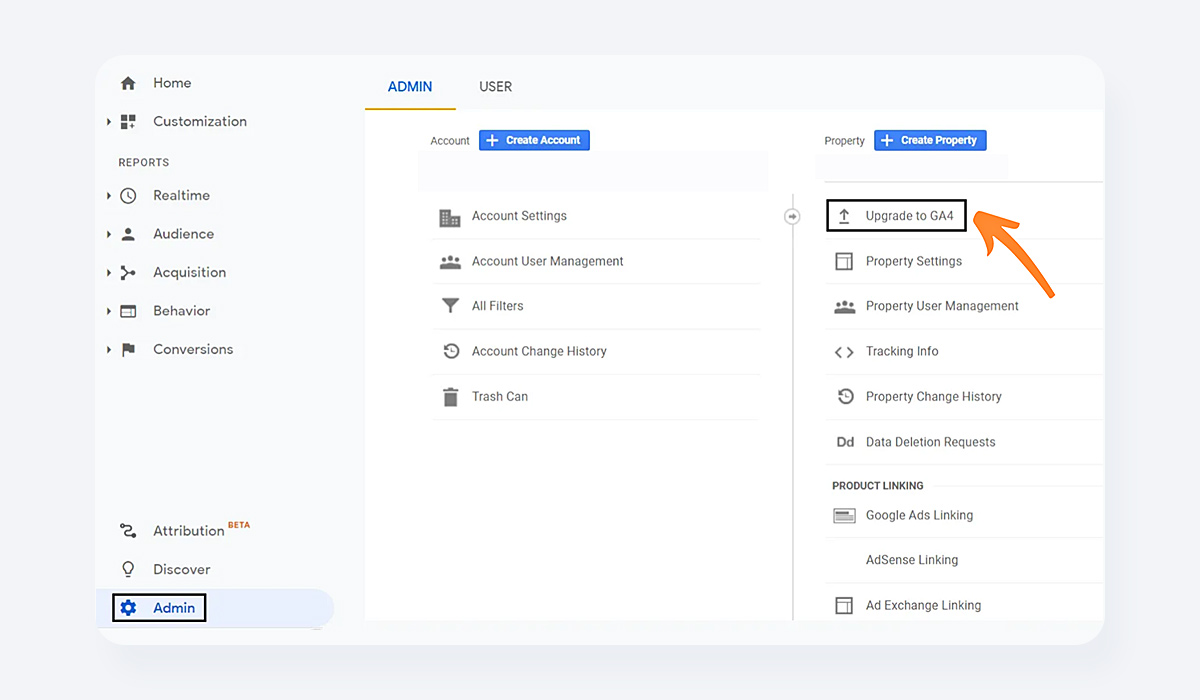
To configure Google Analytics 4, navigate to the “ADMIN” tab and look under the “CREATE PROPERTY” column. Then you'll have to select the first option which is the “SETUP ASSISTANT” to get on your way.
Please keep in mind that if you create a new Google Analytics account from scratch, Google Analytics 4 will be the default experience. If you are looking in from the older UA version, then you may see “UPGRADE TO GA4” in place of where the aforementioned “SETUP ASSISTANT” should be. Be assured that they are interchangeable and clicking on that first option will get the same result and we can proceed from there.
Click CONTINUE, then give your new property a name, a category, and repeat the procedures you took with Google Analytics previously. When you're finished, simply click CREATE. As a result, the system will generate a new property for you.
After that, you must go through the setup assistant and pick TAG INSTALLATION to proceed.
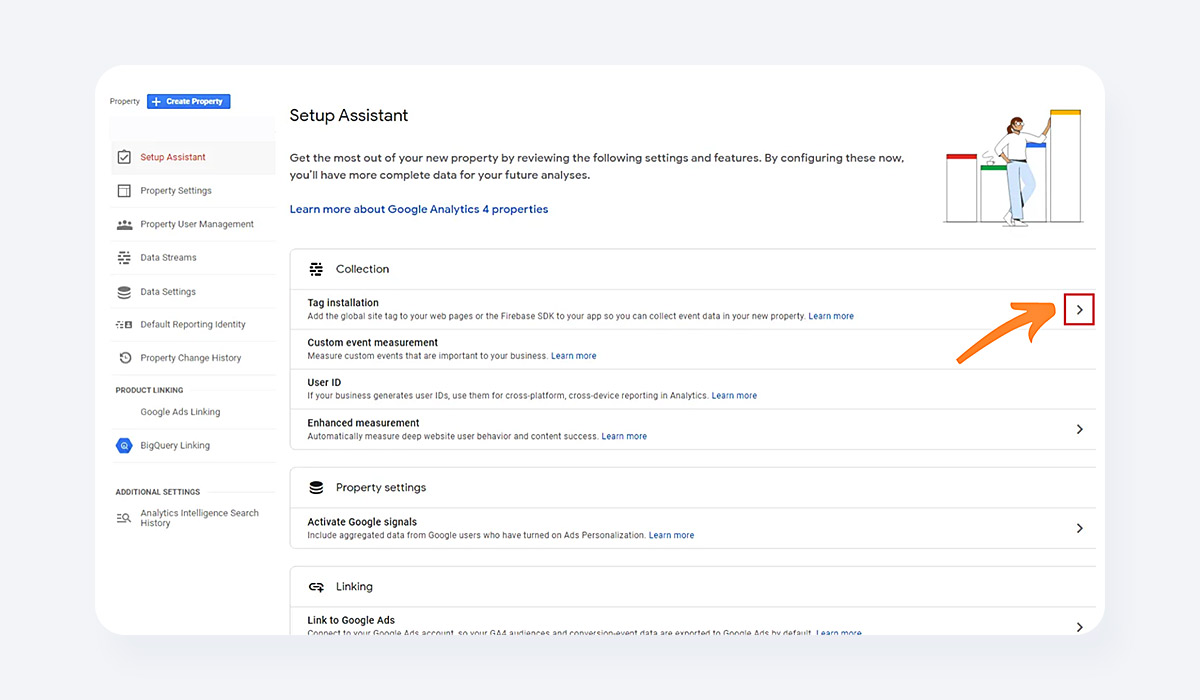
This is where you'll find your selections. To begin with, Google Analytics 4 provides an excellent option for incorporating several streams (app + web).
That is why, if you have an app, a website, or a YouTube channel, you can add numerous streams here, draw in the data, and mix it all.
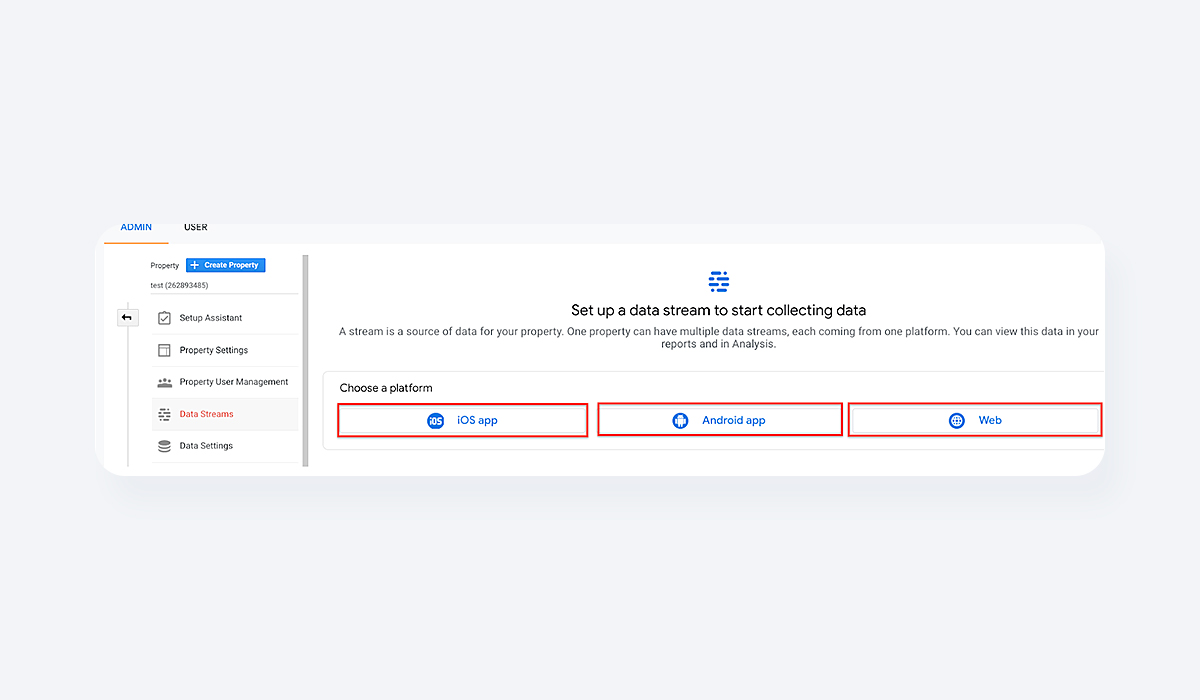
You can use the existing on-page tag by dragging your old tag in and following the assistant's instructions.
You must go to your other property, enter the TRACKING ID, and then enter it on your old property. You can also use Google Tag Manager.
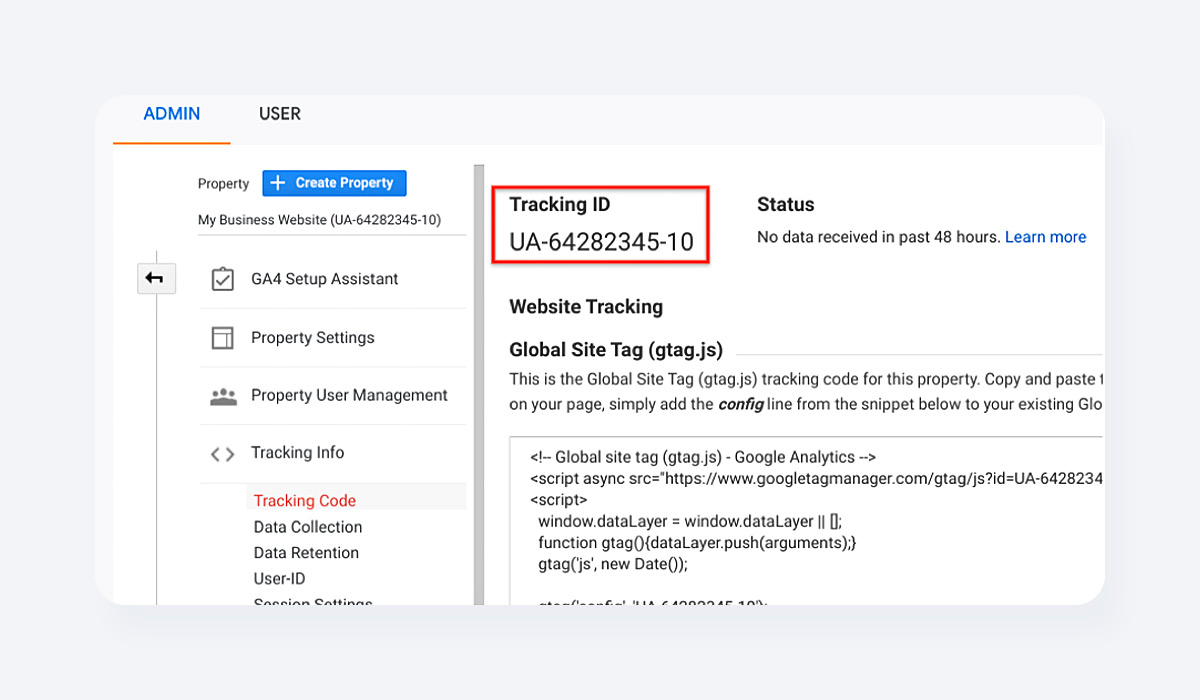
However, we recommend that you create a new tag (the new script itself) and place it in the head section of your page.
Yes, having both old and new properties will be strange, but it may work better for you because it is an entirely different approach to evaluating statistics on your site. Google provided us with the option of deciding and building the entire system in this manner.
In any case, you need Google Analytics 4 since it will help you become a better internet marketer and improve organic traffic to your website.
Oh, and here’s a pro-tip for you - If you are an existing or even a new Shopcada client, all you need to do is go on over to your dashboard and enable the GA4 app in Shopcada.
Now, at this point, you don’t need to fiddle around with much, just fill in the Measurement ID, and presto, we will do the rest for you. See, it’s that simple for you to get up and running with GA4 using Shopcada; no need for all that headache about data layer information, events, or even those ecommerce centric events.
Turnaround time for Google Analytics 4 to show results
The solution is straightforward. It takes approximately 30 minutes for your new property to begin gathering data. If you want to see if Google Analytics 4 has started operating, go to the REPORT NAVIGATION and select REAL-TIME tracking. That's because if Google Analytics has data to show you, you can bet it got it first. As a result, if GA 4 collected the data, everything is in order.
What’s Next
As with any new tool, the best approach to Google Analytics 4 is to assume a learning curve and be prepared to make changes as you learn more about the platform's many possibilities.
Google's new anomaly detection is something to look forward to. For the first time, your analytics will automatically notify you if there is a significant change in your data that you should be aware of right away. If your website stops collecting data overnight, you might be notified rather than discovering it after missing hours of data.
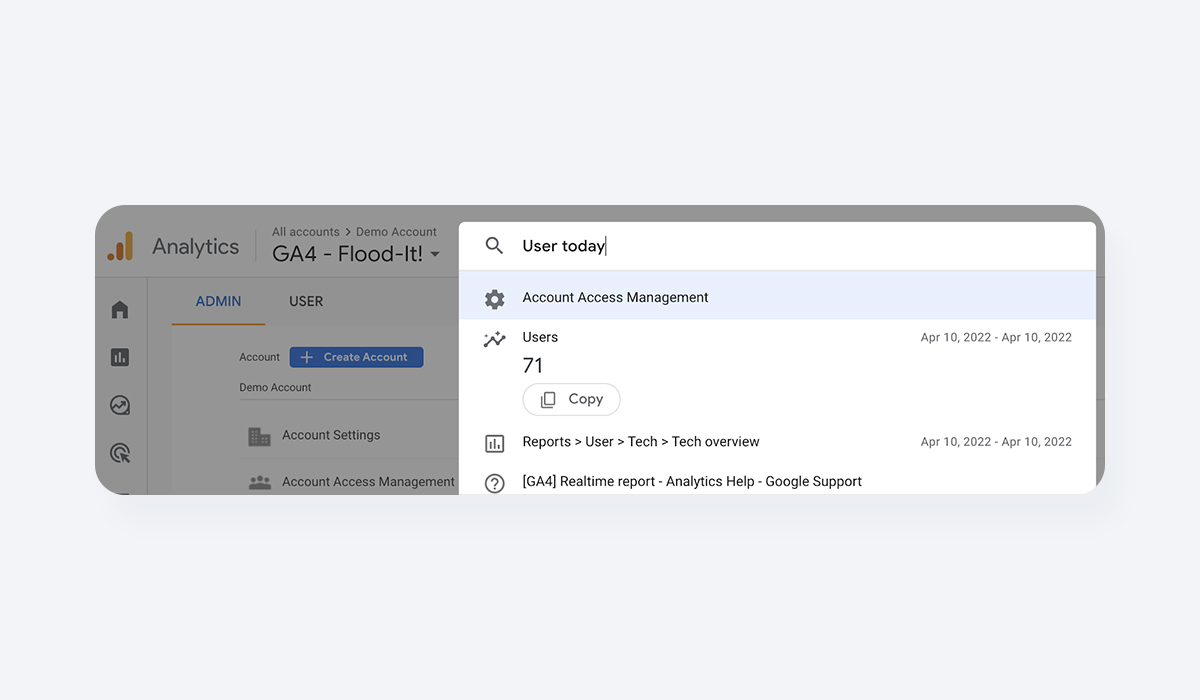
Google Analytics 4 appears to be Google's most user-friendly analytics software to date. Google has also integrated Autosuggest into GA4 in addition to the streamlined analytics, choices for building extensive reports, and hundreds of FAQs already answered. This useful function displays data and suggests search metrics based on your previous activity.
Closing Words
While Universal Analytics will be available until July 2023, we recommend that you have both a Universal Analytics and a Google Analytics 4 property running on your website at the same time.
And, although GA4 was released as a beta in 2019, it is still being optimised with new features regularly. Thus, commencing your move from UA to GA4 today will allow you plenty of time to adjust and exploit previous data.
It's also a good idea to compare metrics between your UA and GA4 properties to find any discrepancies caused by GA4's revised measurement model or event monitoring.
More articles please read Cross Selling & Upselling: Everything You Need To Know!

